library(tidyverse)We’ll be using Premier League results we’ve downloaded in the previous post:
df <- read_csv(
    "EPL.csv",
    col_types = "icccii"
)
df %>%
head()
## # A tibble: 6 x 6
## Season Date HomeTeam AwayTeam FTHG FTAG
## <int> <chr> <chr> <chr> <int> <int>
## 1 1993 14/08/93 Arsenal Coventry 0 3
## 2 1993 14/08/93 Aston Villa QPR 4 1
## 3 1993 14/08/93 Chelsea Blackburn 1 2
## 4 1993 14/08/93 Liverpool Sheffield Weds 2 0
## 5 1993 14/08/93 Man City Leeds 1 1
## 6 1993 14/08/93 Newcastle Tottenham 0 1The first two seasons had 22 clubs competing, down to 20 from 1995 onwards:
df %>%
    count(Season)
## # A tibble: 28 x 2
##    Season     n
##     <int> <int>
##  1   1993   462
##  2   1994   462
##  3   1995   380
##  4   1996   380
##  5   1997   380
##  6   1998   380
##  7   1999   380
##  8   2000   380
##  9   2001   380
## 10   2002   380
## # ... with 18 more rows
Function to generate league tables from match results:
league_table <- function(results) inner_join(
    results %>%
        group_by(
            Team = HomeTeam
        ) %>%
        summarise(
            Pts = sum(FTHG > FTAG) * 3 + sum(FTHG == FTAG) * 1,
            GF = sum(FTHG),
            GA = sum(FTAG),
            .groups = "drop"
        ) %>%
        pivot_longer(
            -Team
        ),
    results %>%
        group_by(
            Team = AwayTeam
        ) %>%
        summarise(
            Pts = sum(FTHG < FTAG) * 3 + sum(FTHG == FTAG) * 1,
            GF = sum(FTAG),
            GA = sum(FTHG),
            .groups = "drop"
        ) %>%
        pivot_longer(
            -Team
        ),
    by = c(
        "Team",
        "name"
    )
) %>%
    transmute(
        Team,
        name,
        value = value.x + value.y
    ) %>%
    pivot_wider() %>%
    arrange(
        -Pts,
        GA - GF,
        -GF,
        rev(Team)
    ) %>%
    mutate(
        Pos = row_number()
    ) %>%
    select(
        Pos,
        everything()
    )
For example, the final standings for 2019/20:
df %>%
    filter(
        Season == 2019
    ) %>%
    league_table() %>%
    print.data.frame(
        row.names = FALSE
    )
##  Pos             Team Pts  GF GA
##    1        Liverpool  99  85 33
##    2         Man City  81 102 35
##    3       Man United  66  66 36
##    4          Chelsea  66  69 54
##    5        Leicester  62  67 41
##    6        Tottenham  59  61 47
##    7           Wolves  59  51 40
##    8          Arsenal  56  56 48
##    9 Sheffield United  54  39 39
##   10          Burnley  54  43 50
##   11      Southampton  52  51 60
##   12          Everton  49  44 56
##   13        Newcastle  44  38 58
##   14   Crystal Palace  43  31 50
##   15         Brighton  41  39 54
##   16         West Ham  39  49 62
##   17      Aston Villa  35  41 67
##   18      Bournemouth  34  40 65
##   19          Watford  34  36 64
##   20          Norwich  21  26 75
League tables for every season from 1995/96 through 2019/20:
df_lt <- df %>%
    filter(
        Season %in% 1995:2019
    ) %>%
    group_by(
        Season
    ) %>%
    group_nest() %>%
    mutate_at(
        vars(data),
        map,
        league_table
    ) %>%
    unnest(
        cols = data
    )
Let’s plot points vs table position, highlighting 4th (Champions League) and 18th (relegation) positions:
ggplot(
    mapping = aes(
        x = Season + .1,
        y = Pts,
        xend = Season + .9,
        yend = Pts
    )
) +
    geom_segment(
        data = df_lt
    ) +
    geom_segment(
        data = filter(
            df_lt,
            Pos == 4
        ),
        colour = "blue",
        size = 1
    ) +
    geom_segment(
        data = filter(
            df_lt,
            Pos == 18
        ),
        colour = "red",
        size = 1
    ) +
    labs(
        x = NULL,
        y = NULL
    ) +
    scale_x_continuous(
        expand = expansion()
    ) +
    scale_y_continuous(
        expand = expansion(
            mult = c(0, .05)
        ),
        limits = c(0, NA)
    ) +
    theme_bw() +
    theme(
        panel.grid.minor = element_blank()
    )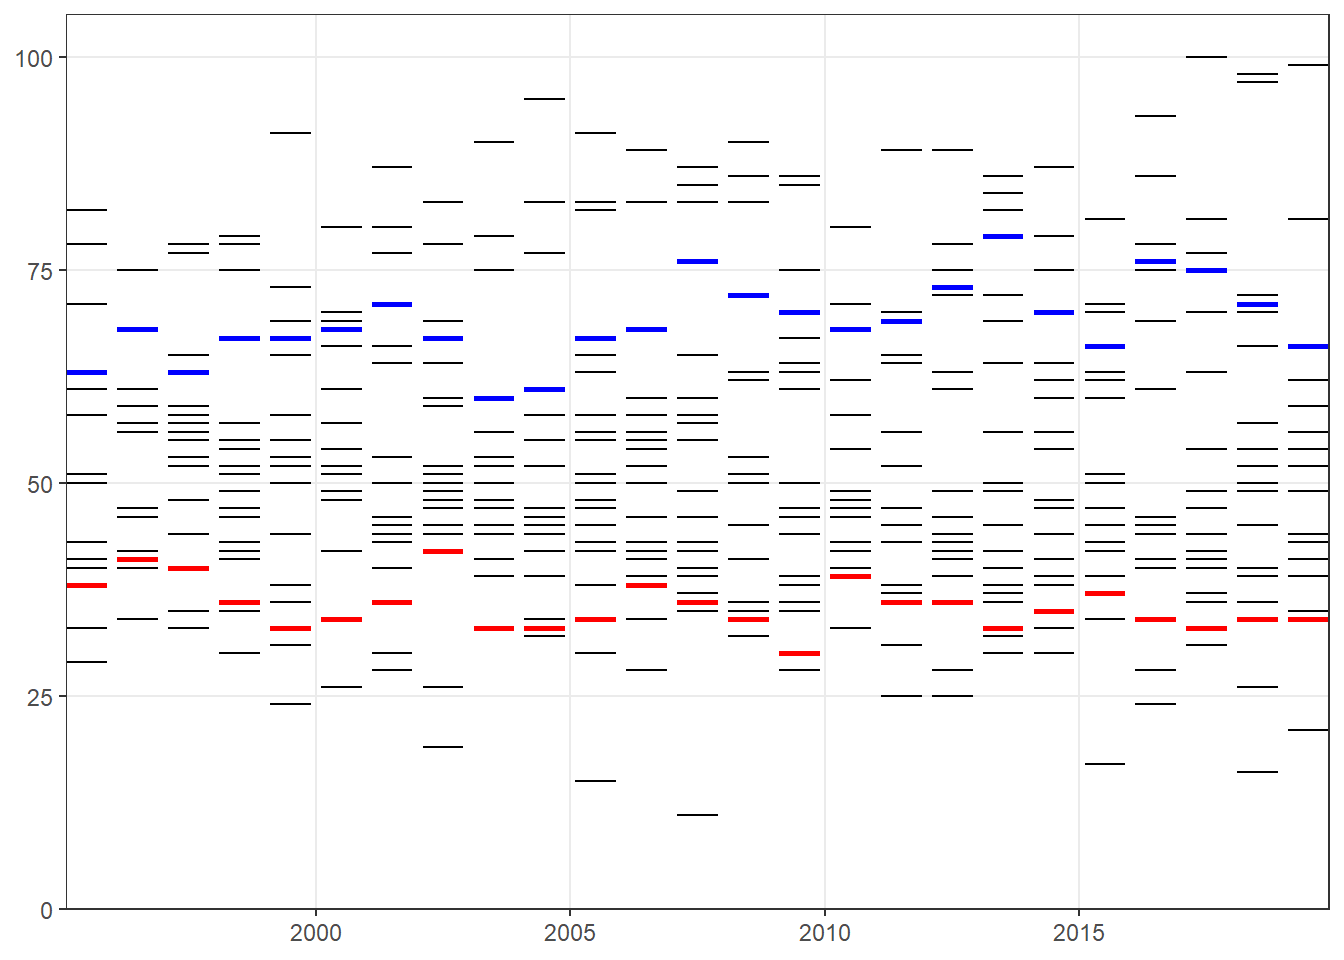
The range of points that were required to get into Top 4:
df_lt %>%
    filter(
        Pos == 4
    ) %>%
    pull(
        Pts
    ) %>%
    range()
## [1] 60 79
…to avoid relegation:
df_lt %>%
    filter(
        Pos == 18
    ) %>%
    pull(
        Pts
    ) %>%
    range()
## [1] 30 42